Recently, similar mobile app reports were released from Kenshoo and Localytics. The former one talked about the key trends noticed in app acquisition data of 2015, while the latter one talked about the engagement and customer retention benchmarks set in the fourth quarter of 2015.
Of the two, the Localytics report took into consideration global data, whereas the Kenshoo report selected 100 countries across the globe for data on the advertising spend and the number of app installs.
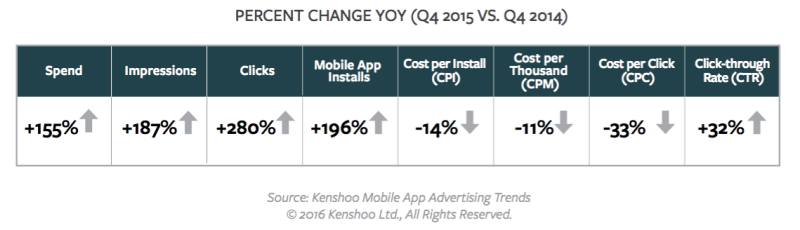
According to the two reports, the ad spend to attract app installs in the fourth quarter of 2015 had increased by over 150%, as compared that in the fourth quarter of 2014. This data includes the click through rates, the number of app installs and the user based impressions, which also grew significantly during the same time period.
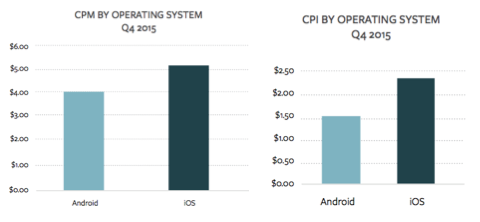
According to Kenshoo report, the seasonal price fluctuation had minimum or no impact as compared to the other digital metrics. The cost stability was at its normal best, conceding a meaningful price cut in the cost-per-install ratio. As per Kenshoo report, the ever so pricey iOS platform delivered low performance metrics in comparison to the Android platform.
The most noticeable feature of the report was the rise of Instagram as an app marketing platform. According to the Kenshoo report, the low priced Instagram ads were also found to be less productive as compared to Facebook when it comes to attracting app installs. The company, however, didn’t share a similar viewpoint and stressed that its platform is indeed an effective medium for driving app installs.
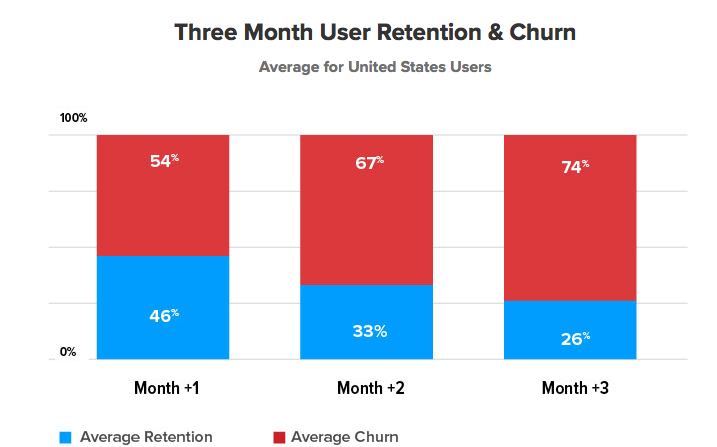
According to the app install report, a maximum number of users (67%) removed apps from their devices in the second month itself, after using it for first 30 days. After the initial period of first three months of an app install, the retention rate of the customers dropped to 25%.
Let’s see what the Localytics report suggests regarding the general app engagement
- The average number of App Launches — 11.48 average app launches on a monthly basis.
- The average period of Session Length — 5.17 minutes on an average spent in any individual app on a monthly basis.
- The average time spent in an app — 59.35 total minutes spent in apps on a monthly basis.
According to Localytics report, app engagement of the users who enable push notifications is likely to differ from those who don’t. Additionally, it’s likely that more than half of the users, who don’t have push notifications enabled on their devices may visit the app only once. The push notifications enabled users have a healthy average of 15.5 app launches on a monthly basis, as compared to the average 6.2 app launches by users who disabled push notifications on their devices.
Here are the top five channels listed by Localytics through which US app users acquire their apps
- Organic Channels
- Opera Mediaworks
- Tapjoy
For more info, write to us at sales@ebrandz.com.